
Quick answer
Conversion rate optimisation (CRO) services improve the share of visitors who buy or enquire through a repeatable process: research with analytics, heatmaps, session recordings and surveys; written hypotheses; prioritisation with a framework such as PIE or ICE; A/B tests with a sample size fixed in advance; and implementation of winners. A good partner shows its method and reports losing tests honestly, never guaranteed uplifts.
Key takeaways
- A CRO engagement is research-led; changes should come from evidence about where and why visitors drop off, not from a list of best practices.
- Every test needs a written hypothesis that links an observed problem, a proposed change and an expected effect on a defined metric.
- PIE and ICE scoring turn a long backlog into a ranked plan, but they are judgement aids, not maths.
- Decide sample size before a test starts and do not stop early when results look good, or false positives multiply.
- Low-traffic sites should prioritise research and fixing clear problems over formal A/B tests that cannot reach a reliable result.
Buying more traffic is the default answer when sales stall, but if a site converts poorly, every extra visitor costs more than it should. Conversion rate optimisation (CRO) is the discipline of finding out why visitors do not buy or enquire, and fixing it in a way you can measure.
The trouble is that "CRO services" can mean anything from a one-off checklist to a rigorous experimentation programme. This guide explains what a proper CRO engagement includes, how the statistics behind A/B testing work in plain terms, and how to tell a capable partner from one that just moves buttons around. For store-specific tactics, see our separate guide to Shopify conversion rate optimisation.
What Does a CRO Engagement Include?
A CRO engagement is a cycle of research, hypotheses, prioritisation, testing and implementation, repeated continuously. The deliverables are a research report, a prioritised test backlog, running experiments, documented results and changes shipped to the live site.
| Phase | What happens | Typical outputs |
|---|---|---|
| 1. Measurement audit | Check analytics, conversion events and funnel tracking are accurate | List of tracking fixes; agreed primary metric |
| 2. Research | Quantitative and qualitative analysis of where and why visitors drop off | Research report with prioritised problems |
| 3. Hypotheses | Turn each problem into a testable statement | Hypothesis backlog |
| 4. Prioritisation | Score ideas with PIE, ICE or a similar model | Ranked roadmap |
| 5. Design and build | Design variants, develop and quality-check them on all devices | Test-ready variants |
| 6. Testing | Run A/B or multivariate tests to a planned sample size | Test results with confidence levels |
| 7. Implementation and learning | Ship winners permanently; record what losing tests taught | Updated site; learning log |
The first month is usually phases 1 to 4. Testing then runs continuously, with research refreshed every few months or after big site changes.
What Research Should Come Before Any Changes?
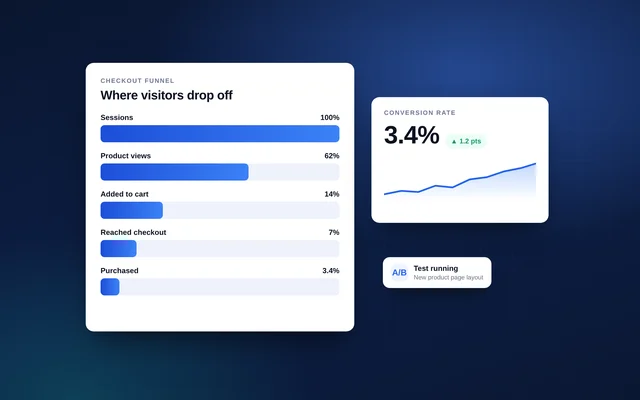
Good CRO starts by finding where visitors drop off (quantitative data) and why (qualitative data). Without that research, changes are guesses, and most guesses either do nothing or make things worse.
- Analytics: funnel drop-off by step, device, traffic source, country and new versus returning visitors. Look for pages with high traffic and high exit rates, and segments that convert far below average.
- Heatmaps: where people click, tap and scroll. They show ignored calls to action, clicks on non-clickable elements and content nobody reaches.
- Session recordings: watching real sessions reveals hesitation, repeated attempts at forms and confusion. Microsoft Clarity, for example, provides session recordings and heatmaps and describes itself as free; Microsoft says it should not be used on sites targeting under-18s.
- On-site and post-purchase surveys: one-question polls such as "What nearly stopped you buying today?" capture objections in the customer's own words.
- Customer and sales interviews: especially for B2B and high-value products, where the reasons behind decisions rarely appear in analytics.
- Usability testing: asking five or so target users to complete a task while thinking aloud quickly exposes friction the team has stopped noticing.
- Heuristic review: an expert walk-through against clarity, relevance, trust, friction and distraction. Useful, but treat findings as hypotheses, not facts.
How Do You Write a Good CRO Hypothesis?
A CRO hypothesis links an observed problem, a proposed change and an expected effect on a defined metric. Writing it down before testing stops the team from rationalising whatever result appears.
A useful template: "Because we observed [evidence], we believe that [change] for [audience] will cause [effect on primary metric]. We will know when [metric] changes by at least [minimum effect] after [sample size]."
For example: "Because session recordings show mobile visitors scrolling past the delivery information and survey responses mention shipping cost surprises, we believe showing delivery cost and timing beside the add-to-cart button on mobile will increase checkout starts." The evidence, audience and metric are all explicit, so the result teaches something whichever way it goes.
How Are CRO Ideas Prioritised with PIE and ICE?
Prioritisation frameworks score each idea on a few factors so the team tests the most valuable ideas first. PIE and ICE are the most common; both are structured judgement rather than precise measurement.
| Framework | Factors | Origin | Strength | Weakness |
|---|---|---|---|---|
| PIE | Potential, Importance, Ease (each 1–10, averaged) | Chris Goward, WiderFunnel | Pushes tests toward high-traffic, high-value pages | "Potential" is easy to inflate for favourite ideas |
| ICE | Impact, Confidence, Ease | Sean Ellis, GrowthHackers | Rewards ideas backed by strong research evidence | Confidence scores are subjective without clear rules |
| Binary or weighted checklists (for example PXL-style) | Yes/no questions such as "above the fold?", "supported by user research?" | Various practitioners | Less subjective; easier to score consistently | Takes longer to set up |
Whichever model you use, score as a group, write down why each score was given, and revisit scores when new research arrives. The value is in forcing an explicit conversation, not in the decimal places. The PIE and ICE frameworks are summarised in more detail by Growth Method.
What Statistics Do You Need to Understand A/B Testing?
An A/B test splits visitors randomly between the current version and a variant, then checks whether the difference in conversion rate is larger than chance would explain. The essential rules are to set the sample size in advance, run full weeks and avoid stopping as soon as a result looks significant.
Key terms in plain English:
- Statistical significance: how unlikely the observed difference would be if the variant made no real difference. A 95% threshold is common.
- Statistical power: the chance the test detects a real effect of the size you care about. 80% is a common target.
- Minimum detectable effect (MDE): the smallest improvement worth detecting. Smaller effects need far larger samples.
- Sample size: calculated from your baseline conversion rate, MDE, significance and power before the test starts.
- Sample ratio mismatch: when traffic does not split in the planned proportions, a sign of a technical fault that invalidates results.
The most common error is "peeking". Evan Miller's widely cited essay How Not To Run an A/B Test shows that checking results repeatedly and stopping when they cross a significance threshold inflates false positives sharply; in his example, checking after every observation turns a nominal 5% significance level into 26.1%. His advice is to decide the sample size in advance and stick to it, or use sequential or Bayesian methods designed for continuous monitoring.
Also run tests for whole weeks to cover weekday and weekend behaviour, avoid launching during major sales unless that is the context you are testing, and segment results cautiously: slicing a finished test into many segments will find "winners" by chance.
Which Tools Do CRO Teams Use?
A typical stack combines analytics, behaviour tools, a testing platform and a survey tool. Google Optimize, once the default free option, closed on 30 September 2023; Google named AB Tasty, Optimizely and VWO as testing providers it was building integrations with for Google Analytics 4 (GA4).
- Analytics: GA4 or the platform's own analytics, such as Shopify's reports.
- Behaviour: heatmaps and session recordings (Microsoft Clarity, Hotjar and similar).
- Testing: a client-side or server-side A/B testing platform suited to your traffic and tech stack.
- Research: on-site polls, post-purchase surveys and remote usability testing.
- Documentation: a shared backlog and learning log, so knowledge survives staff changes.
Behaviour and testing tools set cookies or similar identifiers, so in the UK and EU they must respect your consent banner. That reduces the share of visitors you can observe, which is worth factoring into sample size planning.
How Do You Judge a CRO Partner?
Judge a CRO partner on method, transparency and statistical discipline, not on promised uplifts. Ask to see a real research report, a hypothesis backlog and a test write-up, including a losing test.
Questions worth asking:
- What research will you do before proposing changes, and what will the report contain?
- How do you calculate sample size, and what do you do if a test cannot reach it?
- How do you prioritise ideas, and can we see a scored backlog?
- Who builds and quality-checks variants, and how do you avoid page flicker and broken layouts?
- What do you do with tests that lose or are inconclusive?
- How do winning changes get implemented permanently in our site's code, rather than living forever in the testing tool?
Red flags include guaranteed percentage increases, tests declared after a few days, no mention of sample size, and recommendations copied from generic "best practice" lists. For paid traffic specifically, CRO and ad landing pages overlap heavily; see landing pages for Meta and Google Ads and how creative choices feed them in Meta ads for Shopify stores. Product page structure is covered in our anatomy of a high-converting Shopify product page.
How VEATEX Helps
VEATEX is a Shopify, web and software development agency that also builds Peppol e-invoicing platforms for the GCC, working with clients in the US, UK and the Gulf for over 11 years. Our CRO work combines research and analytics with the development skill to build and ship changes properly, from product pages to complex flows such as the custom subscription builder we built for Joyful Cacao and the pergola configurator we built for Rijpex. We report every test result, including the ones that lose. See our CRO and growth services or get in touch.
Frequently Asked Questions
How long does a CRO engagement take to show results?
Research and quick fixes for obvious problems can show effects within the first few weeks. A/B testing takes longer because each test must run for at least one or two full business cycles, usually whole weeks, and reach its planned sample size. Most programmes judge progress quarterly, by the number of quality tests completed and the cumulative effect of implemented winners.
Do I need a lot of traffic for CRO?
You need enough traffic and conversions for A/B testing, but not for CRO as a whole. Sites with few conversions per week cannot detect modest improvements reliably in a reasonable time. They gain more from research, usability testing, fixing analytics, removing friction and testing only large, bold changes. As traffic grows, a structured testing programme becomes viable.
What is the difference between PIE and ICE prioritisation?
PIE, created by Chris Goward at WiderFunnel, scores Potential, Importance and Ease from 1 to 10 and averages them. ICE, associated with Sean Ellis, scores Impact, Confidence and Ease. The main difference is that ICE includes confidence in the evidence behind an idea, while PIE weights how important the page is through its traffic and cost. Both are subjective, so score as a team.
Which A/B testing tools are used now that Google Optimize has closed?
Google Optimize closed on 30 September 2023. Google pointed users to third-party tools including AB Tasty, Optimizely and VWO, which integrate with Google Analytics 4. Other options include Convert and platform-specific apps for Shopify. The right tool depends on traffic, whether tests run client-side or server-side, privacy needs and how well it works with your site's code.
Should a CRO agency guarantee a conversion rate increase?
No. Many well-designed tests lose or show no difference, and an honest programme reports those results because they prevent harmful changes and teach you about your customers. A guarantee usually means the agency will claim credit for seasonal swings or stop tests early. Look instead for commitments on process: research depth, test velocity, documentation and statistical standards.
Is CRO different for UAE or Gulf websites?
The process is the same, but research often uncovers market-specific friction. Common examples are Arabic and right-to-left layout problems, missing cash on delivery or buy now, pay later options, unclear delivery times to different emirates, and WhatsApp contact expectations. Segment analytics and recordings by language and country so problems affecting one market are not hidden in averages.
Sources
- How Not To Run an A/B Test — Evan Miller
- [Sunset September 2023] Google Optimize — Google Analytics Help
- About Clarity — Microsoft Learn
- PIE framework — Growth Method
- ICE framework — Growth Method
Facts checked against the sources above as of 7 Oct 2026. Rules and platform features change, so confirm time-sensitive details before acting.

VEATEX Editorial Team
Written by the strategists, developers and e-invoicing engineers at VEATEX, a Shopify, web and software development agency that also builds Peppol e-invoicing platforms for the GCC, with 1,200+ projects delivered over 11+ years. About us